
Memory Profiling CPython Applications with Memray
Memory management in modern programming languages is well-abstracted away from programmers. We do not have direct control over how our programs allocate and free memory for all data structures and objects. And it’s true that we have bigger problems to solve than memory management.
However, we occasionally face situations where our applications slow down or even crash due to inefficient or excessive memory usage. We mostly identify these issues through monitoring system alerts or by watching the application’s metrics in practice. This is precisely when we should rely on the assistance of the memory profiler.
What is memory profiling?
Memory profiling is a process of monitoring and analyzing a program’s memory usage during its execution.
The goals of this process are the followings:
- Identifying memory leaks: by identifying and addressing memory leaks, we can prevent out-of-memory (OOM) errors, which can be hard to detect.
- Cost savings: with efficient memory usage, we can save up cost on resource.
- Performance improvement: optimizing data structurs and algorithms can help improve performance.
A memory profiler is a tool for precisely these purposes.
Memory management in CPython and caveats when memory profiling
It is worth briefly noting how memory management works in CPython (hereafter Python) before getting into memory profiling.
Python uses the pymalloc allocator as the default memory allocator:
- For small objects (<= 512 bytes), it uses memory mappings called “arenas”.
- For large objects (> 512 bytes), it delegates to the system allocator (
malloc(),calloc(),realloc()andfree()).
The pymalloc allocator is optimized for small objects. It creates arenas with a fixed size of 1 MiB on 64-bit platforms or 256 KiB on 32-bit platforms for objects whose sizes are smaller or equal to 512 bytes. This way, it can avoid calling too many memory allocation requests for all small objects that are likely to be created more frequently than larger ones.
The diagram below illustrates an example of arenas:
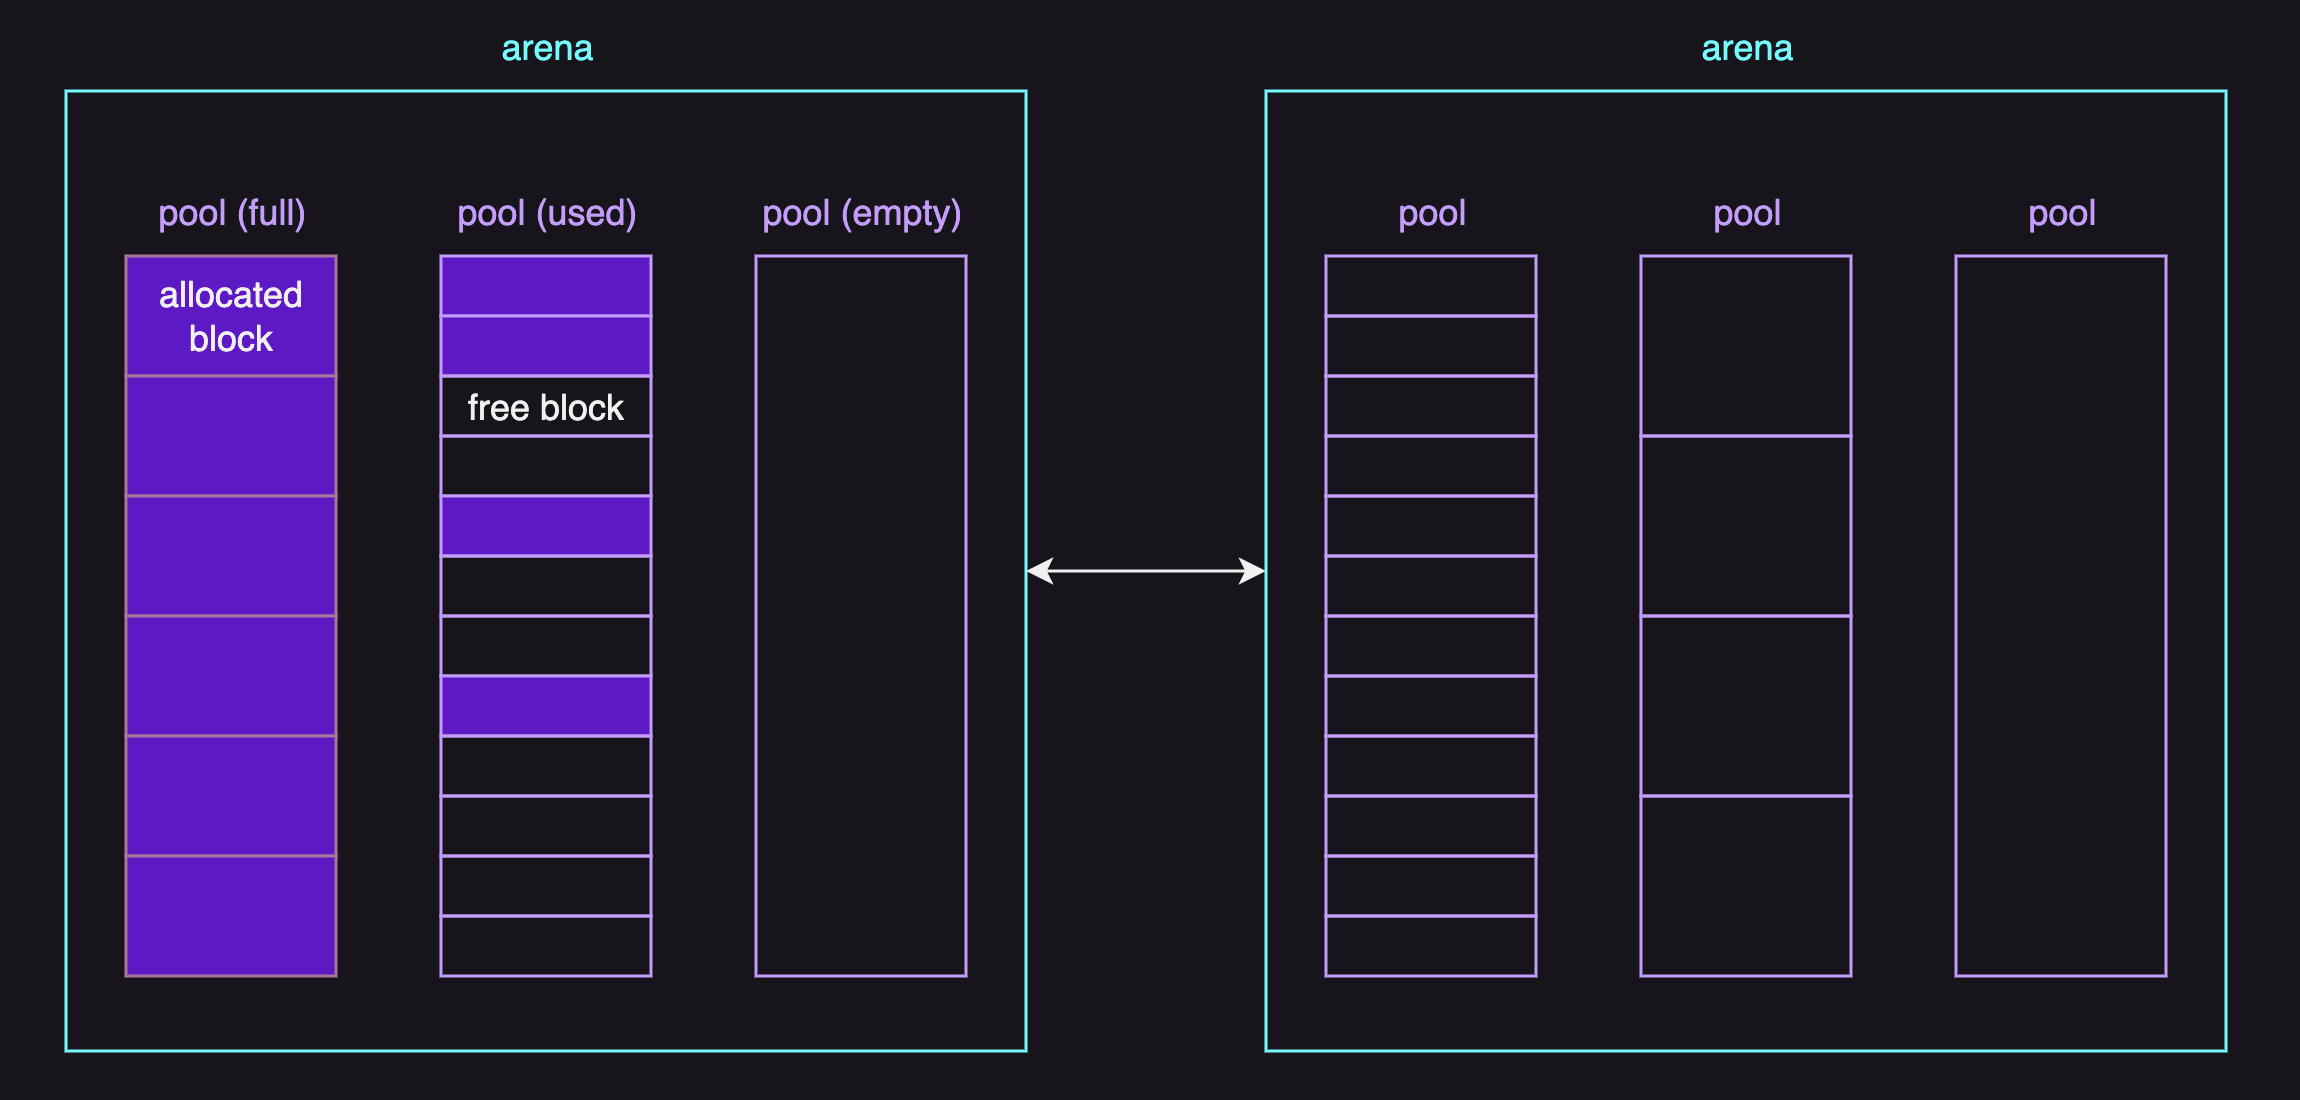
To describe each data structure briefly:
- Areans are subdivided into pools by the size class.
- Pools are fragemented into fixed-size blocks.
- Blocks are the smallest units where small objects are stored.
The important thing here is that while pools are just marked as empty when all of their blocks are not being used and available for allocation, arenas can be actually freed back to the operating system when their pools are all empty.
And as an additional note, from Python 3.9, one empty arena can still remain so as to avoid thrashing in some rare cases where a simple loop woulde create and destroy an arena on every iteration.
You can set PYTHONMALLOCSTATS environment variable to print statistics of the pymalloc memory allocator every time a new pymalloc object arena is created, and on shutdown.
This gives us a few considerations when memory profiling:
- Allocation requests that do not require the system allocator won’t appear in the result of memory profiling.
- Allocation requests that require a new arena will appear in the result, but with the size of the arena.
- Deleting objects does not always free memory if the arena is still in use, resulting in memory leaks in the result. (a false positive)
In short, it is quite difficult to precisely track all memory allocations and deallocations, especially for small objects.
(Unless you disable the pymalloc allocator at runtime with the PYTHONMALLOC=malloc environment variable, which is generally not recommended as it does not represent the actual case.)
When memory profiling in Python does help would be when you have to understand the cause of the observably abnormal memory leaks or found out excessive memory usage.
Memray
Memray is a memory profiler for Python, released on April 9, 2022, by Bloomberg.
The examples in this post uses Python 3.11.4 and Memray 1.10.0.
Memray only works on Linux and MacOS at the time of writing this post.
Installation
You can install it in your virtual environment with pip:
pip install memray
You should then be able to run memray command in your CLI.
$ memray -V
1.10.0
Basic Usage
I am going to create an empty Python file named app.py to start with:
# app.py
You can track memory usage app.py and generate profile results of it with memray run:
$ memray run --output app.bin app.py
Writing profile results into app.bin
[memray] Successfully generated profile results.

You can now generate reports from the stored allocation records.
Some example commands to generate reports:

/.../python3.11 -m memray flamegraph app.bin
I intentionally set the name of the output to app.bin to simplify the example.
Without --output or -o argument, the default name of the output file is <process_name>.<pid>.bin
You can then convert the results into different types of human-readable reports with the following subcommands:
flamegraphtabletreesummarystats
I am going to use flamegraph in particular to visualize the results as it offers an intuitive hierarchical view of function calls with the width representing how much memory that function call and its childern allocates.
The following command generates an HTML flame graph out of app.bin:
$ memray flamegraph app.bin
Wrote memray-flamegraph-app.html
Here is how our flame graph looks like:
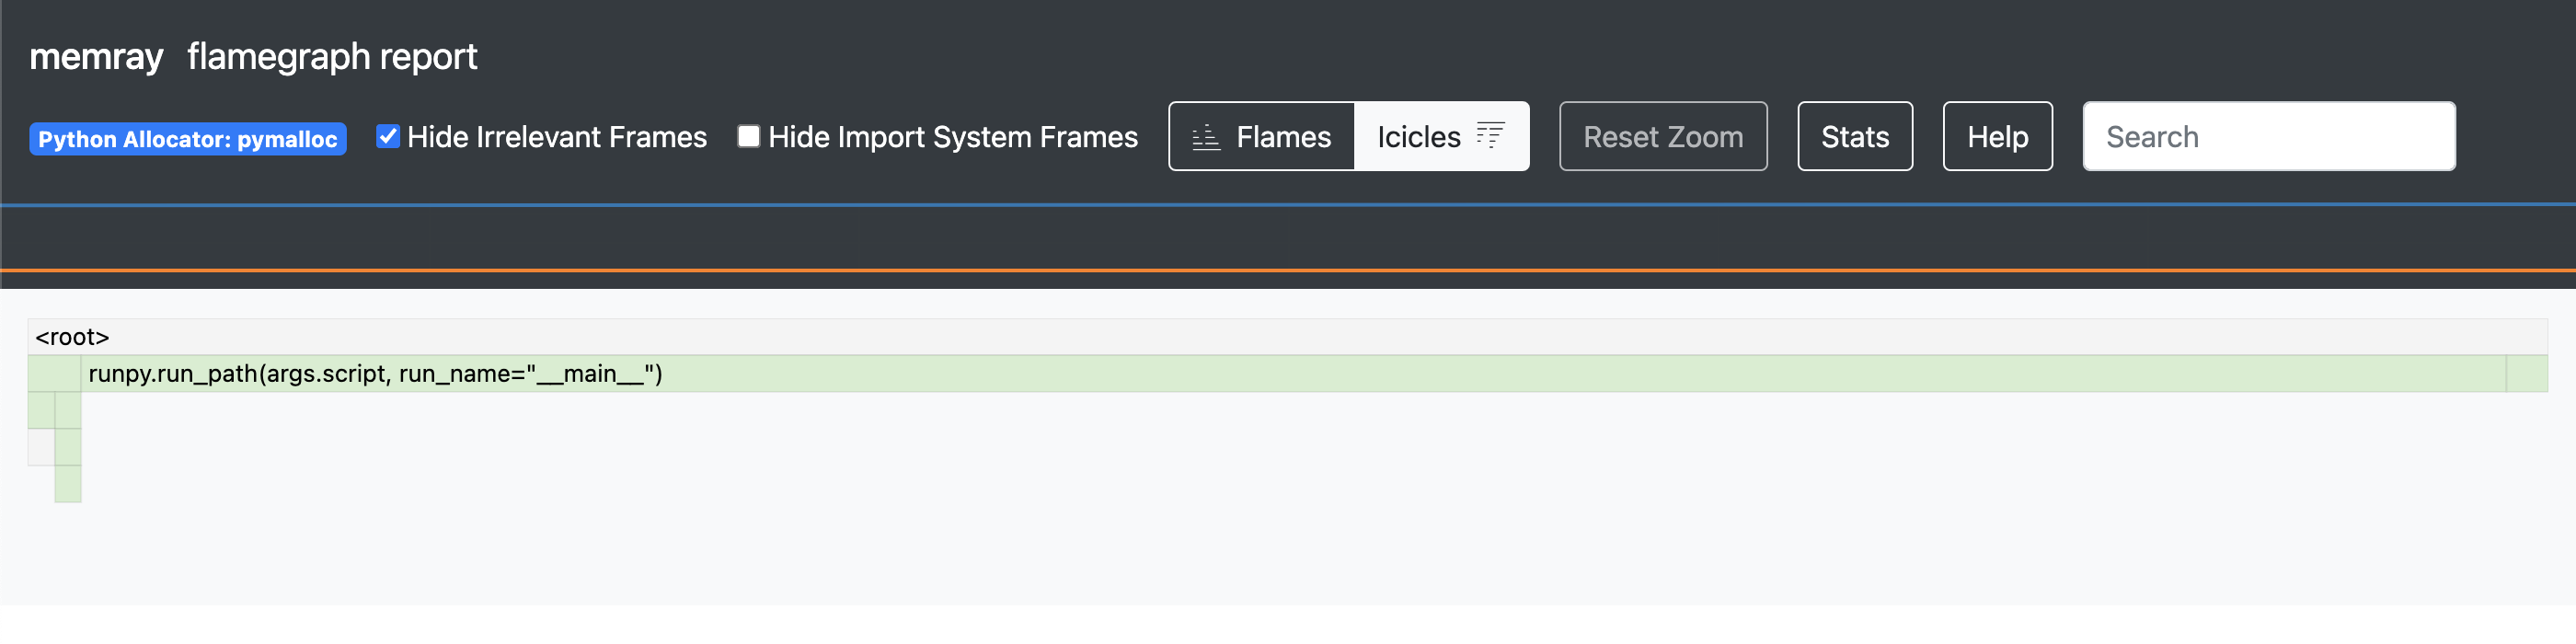
There is not much to see in our first example but this is just to illustrate how it looks from the scratch.
Do also note that your results might look different from the screenshot here because the horizontal ordering in the graph has nothing to do with the passage of time in the application.
You can see the peak memory usage by looking Stats on the header, which will show the following information:
...
Total number of allocations: 139
Total number of frames seen: 65
Peak memory usage: 66.9 KiB
Python allocator: pymalloc
We can confirm that the peak memory usage of our empty app.py is 66.9 KiB.
Bearing in mind that memray itself allocates some amount of memory, it’s safe to assume that the Python interpreter uses a minimum of 66.9 KiB or so, based on our first results.
Now let’s make some observable memory allocations by importing an external package: httpx.
You can install httpx with:
$ pip install httpx
And our example is:
# app.py
import httpx
The flame graph looks like the following:
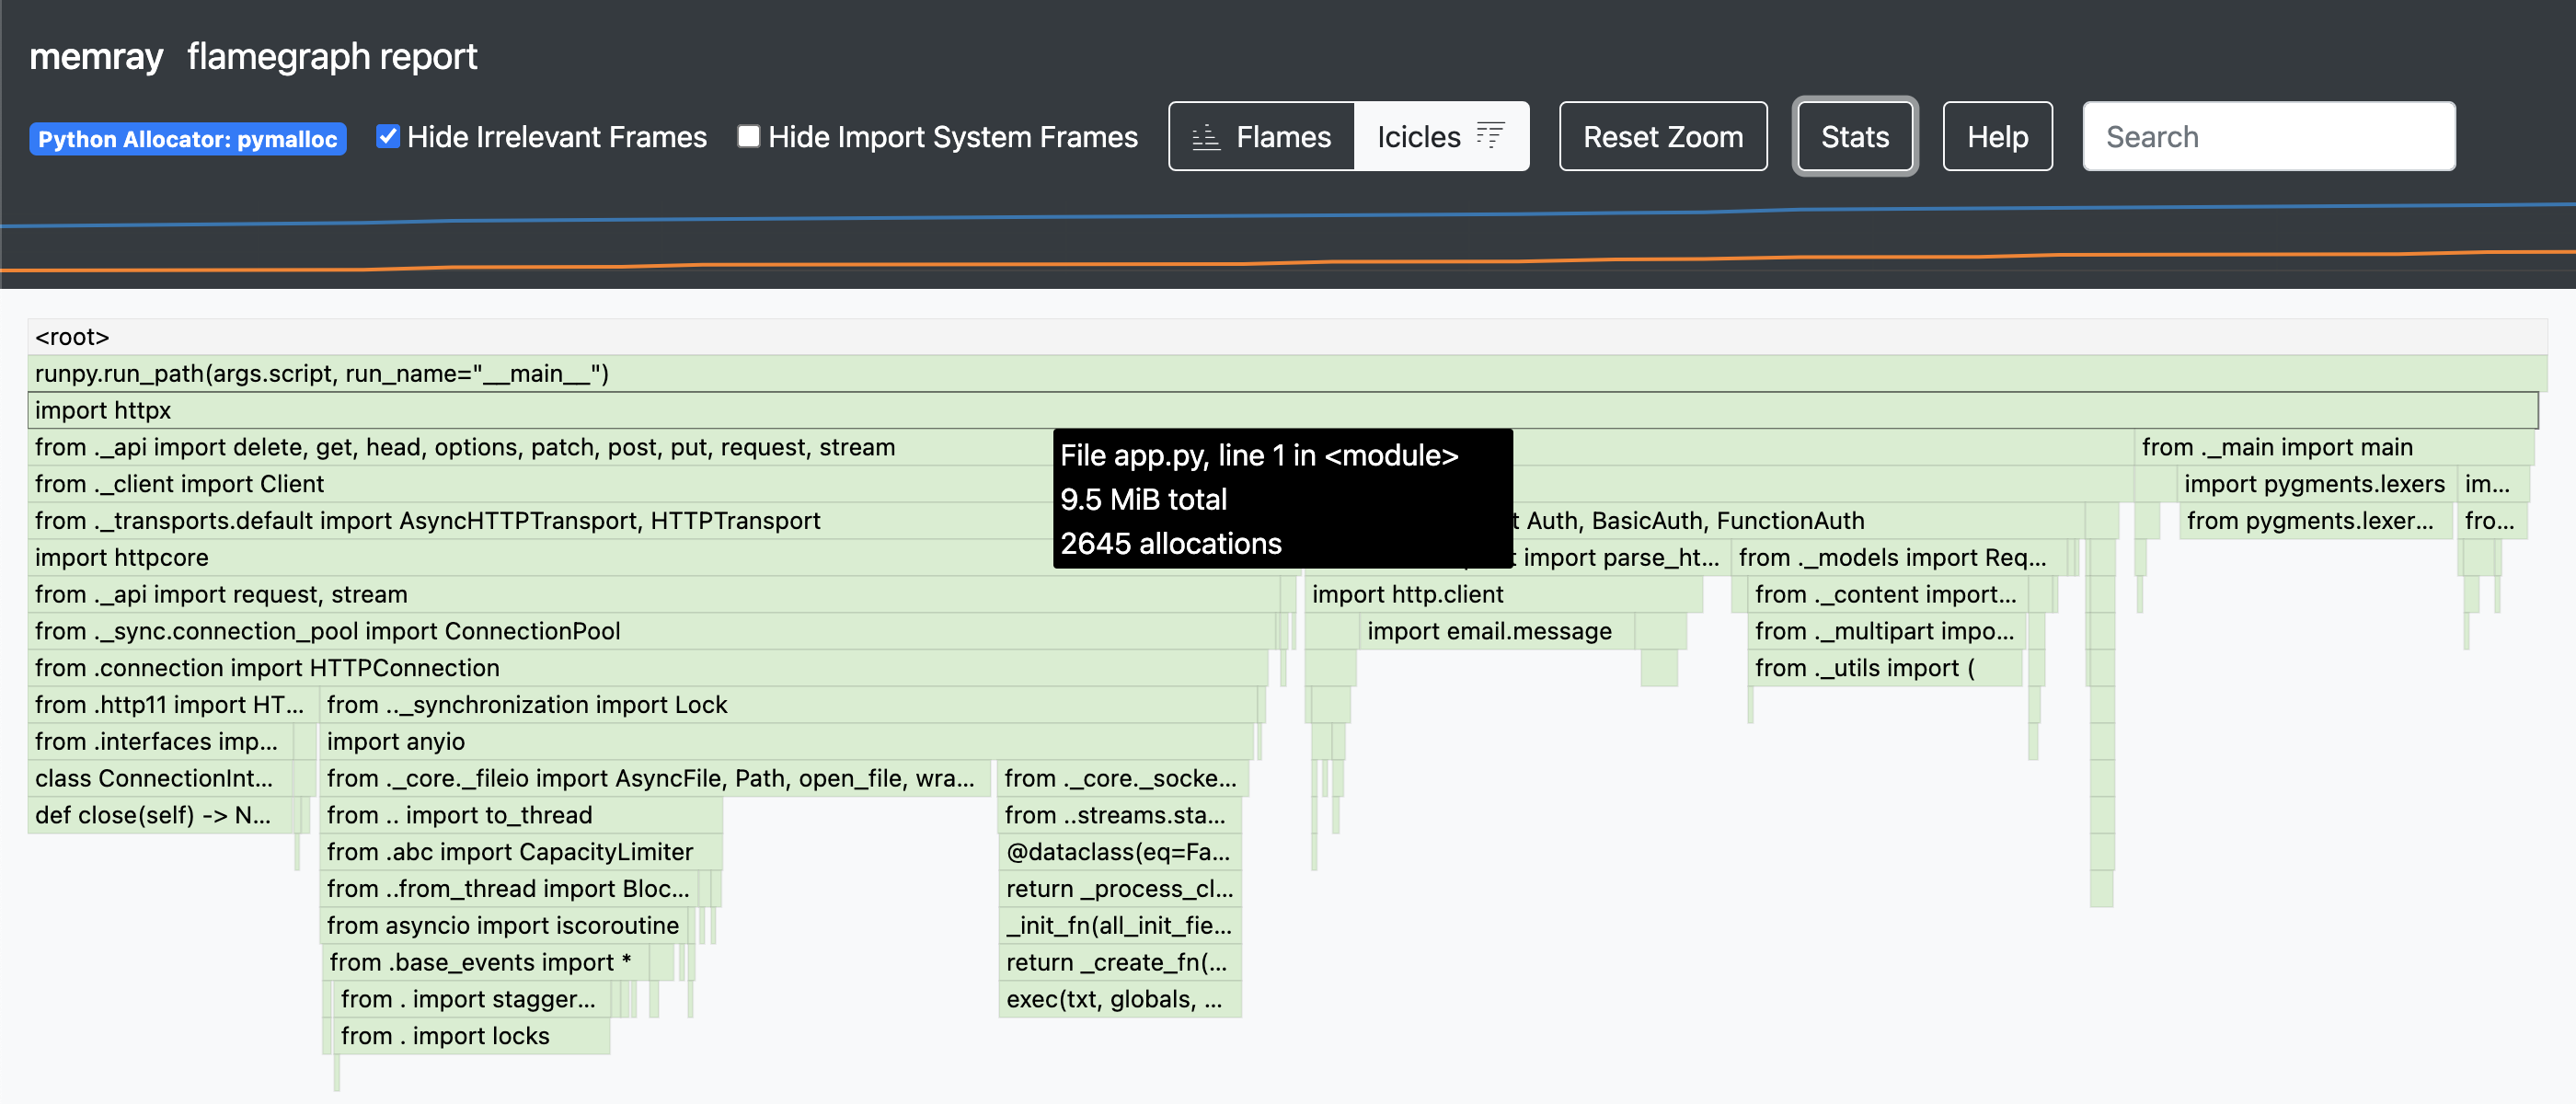
By putting the mouse pointer on the third topmost stack frame which is import httpx, we can see that it requested memory allocations of 9.5 MiB.
Under that frame, the child frames include other external libraries that httpx imports (depends on) such as httpcore and certifi.
You can expand those frames to look inside by clicking them.
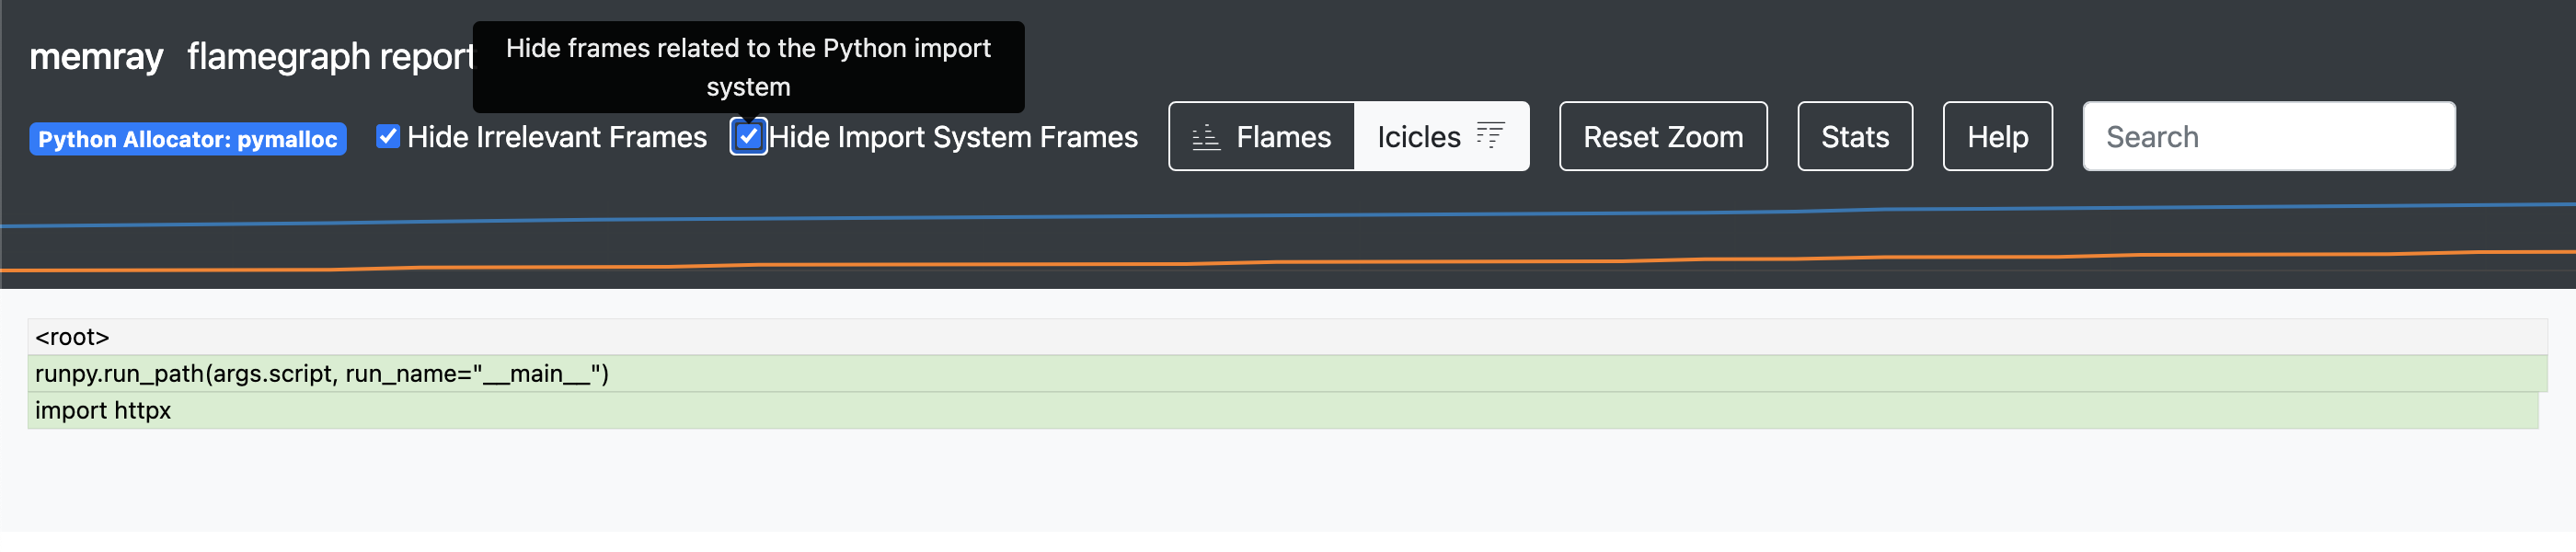
If you are not interested in the memory allocations related to the Python import system, checking Hide Import System Frames gives you the cleaner graph:
Now that we have seen how Python’s import system allocates memory for importing libraries, we will see how the user code appears in the graph. Here is the example:
# app.py
def foo() -> list[int]:
    array = [0 for _ in range(5000)]
    return array

def bar() -> list[int]:
    array = [1 for _ in range(10000)]
    return array

def baz() -> list[int]:
    array = foo() + bar()
    return array

baz()
The flame graph with the <root> at the top looks as follows:
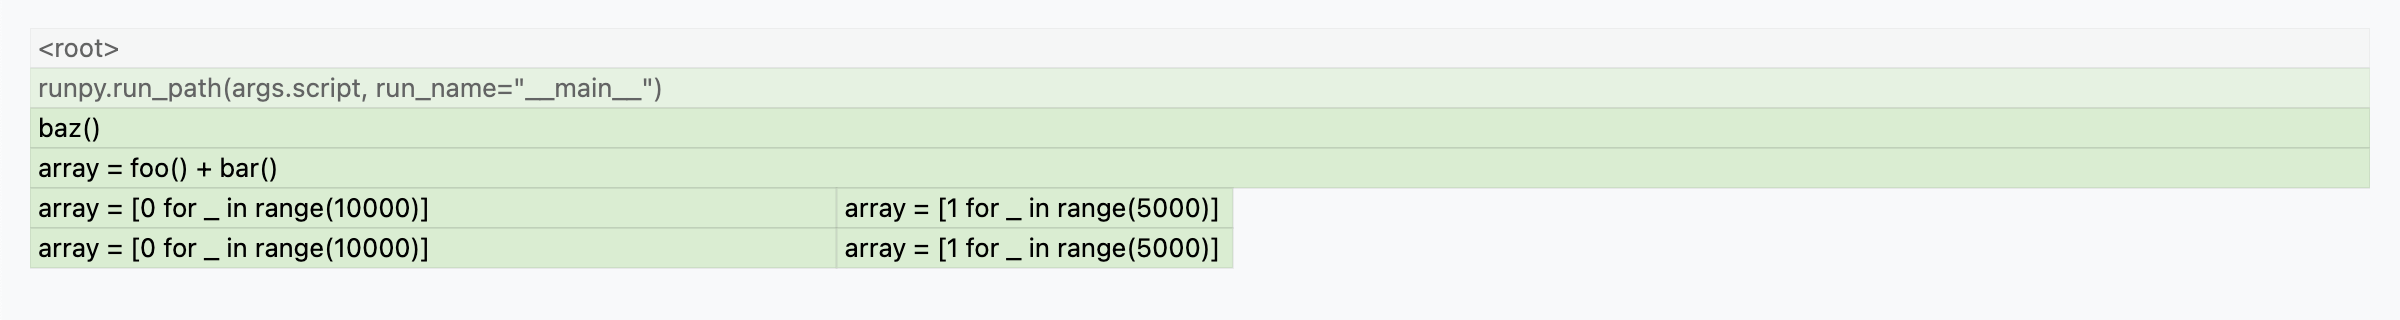
baz() called foo() and bar(), and the width of foo()(array = [0 for _ in range(10000)]) is wider than that of bar()(array = [0 for _ in range(20000)]) as it allocated more memory than bar().
In many cases, the widest box from the end of the stack is probably a good place to start considering optimization.
You can read more information and details about the flame graph reporter in the docs.
Live tracking mode
Memray also allows you to live track the memory usage of an application or an already running process.
You can directly start executing and live-tracking a Python program:
$ memray run --live app.py
Or live track an already running process:
$ memray attach <pid>
Both methods run a terminal user interface (TUI) displaying the memory usage in real time. This is particularl useful for tracking memory allocations of long running appliations such as web applications.
memray attach works by injecting executable code into a running process.
As it might lead to process crashes or deadlocks in the attached process, the authors of memray advises using memray attach for debugging purposes only.
Patterns of memory inefficiency
Here are some common patterns of memory inefficiency, which could result in excessive memory usage or memory leaks.
List comprehensions with large iterables
Here’s the simplest example of memory inefficient code:
array = [i for i in range(9999999)]
Storing a lot of values in an array can be memory inefficient when dealing with large datasets or ranges like this example.
We can use memray to see the peak memory usage of this code.
The following summary is from stats of its flame graph:
Total number of allocations: 980
Total number of frames seen: 69
Peak memory usage: 396.0 MiB
Python allocator: pymalloc
To improve this code, we can use a generator expression instead of a list comprehension:
array = (i for i in range(9999999))
Generator expressions “yield” values one at a time instead of storing all the values in the memory at once.
We can see the peak memory usage of iterating over a generator object array is dramatically decreased:
Total number of allocations: 161
Total number of frames seen: 64
Peak memory usage: 66.9 KiB
Python allocator: pymalloc
Circular references
Circular referencese can lead to memory leaks, considering that the Python interpreter employs reference counting for garbage collection.
Here’s an example:
class Node:
    def __init__(self):
        self.array = [i for i in range(100000)]  # large enough to cause memory allocation
        self.next = None

def create_circular_refrences():
    node1 = Node()
    node2 = Node()
    node1.next = node2
    node2.next = node1
Because node1 and node2 reference each other in a circular manner, their reference counts cannot be set to 0, preventing them from being garbage collected.
The following code leads to memory leaks by iterating create_circular_refrences over 10 times:
for i in range(10):
    create_circular_refrences()
At the top of the flame graph page generated from this code includes a chart that visualizes the process’s memory usage over time:
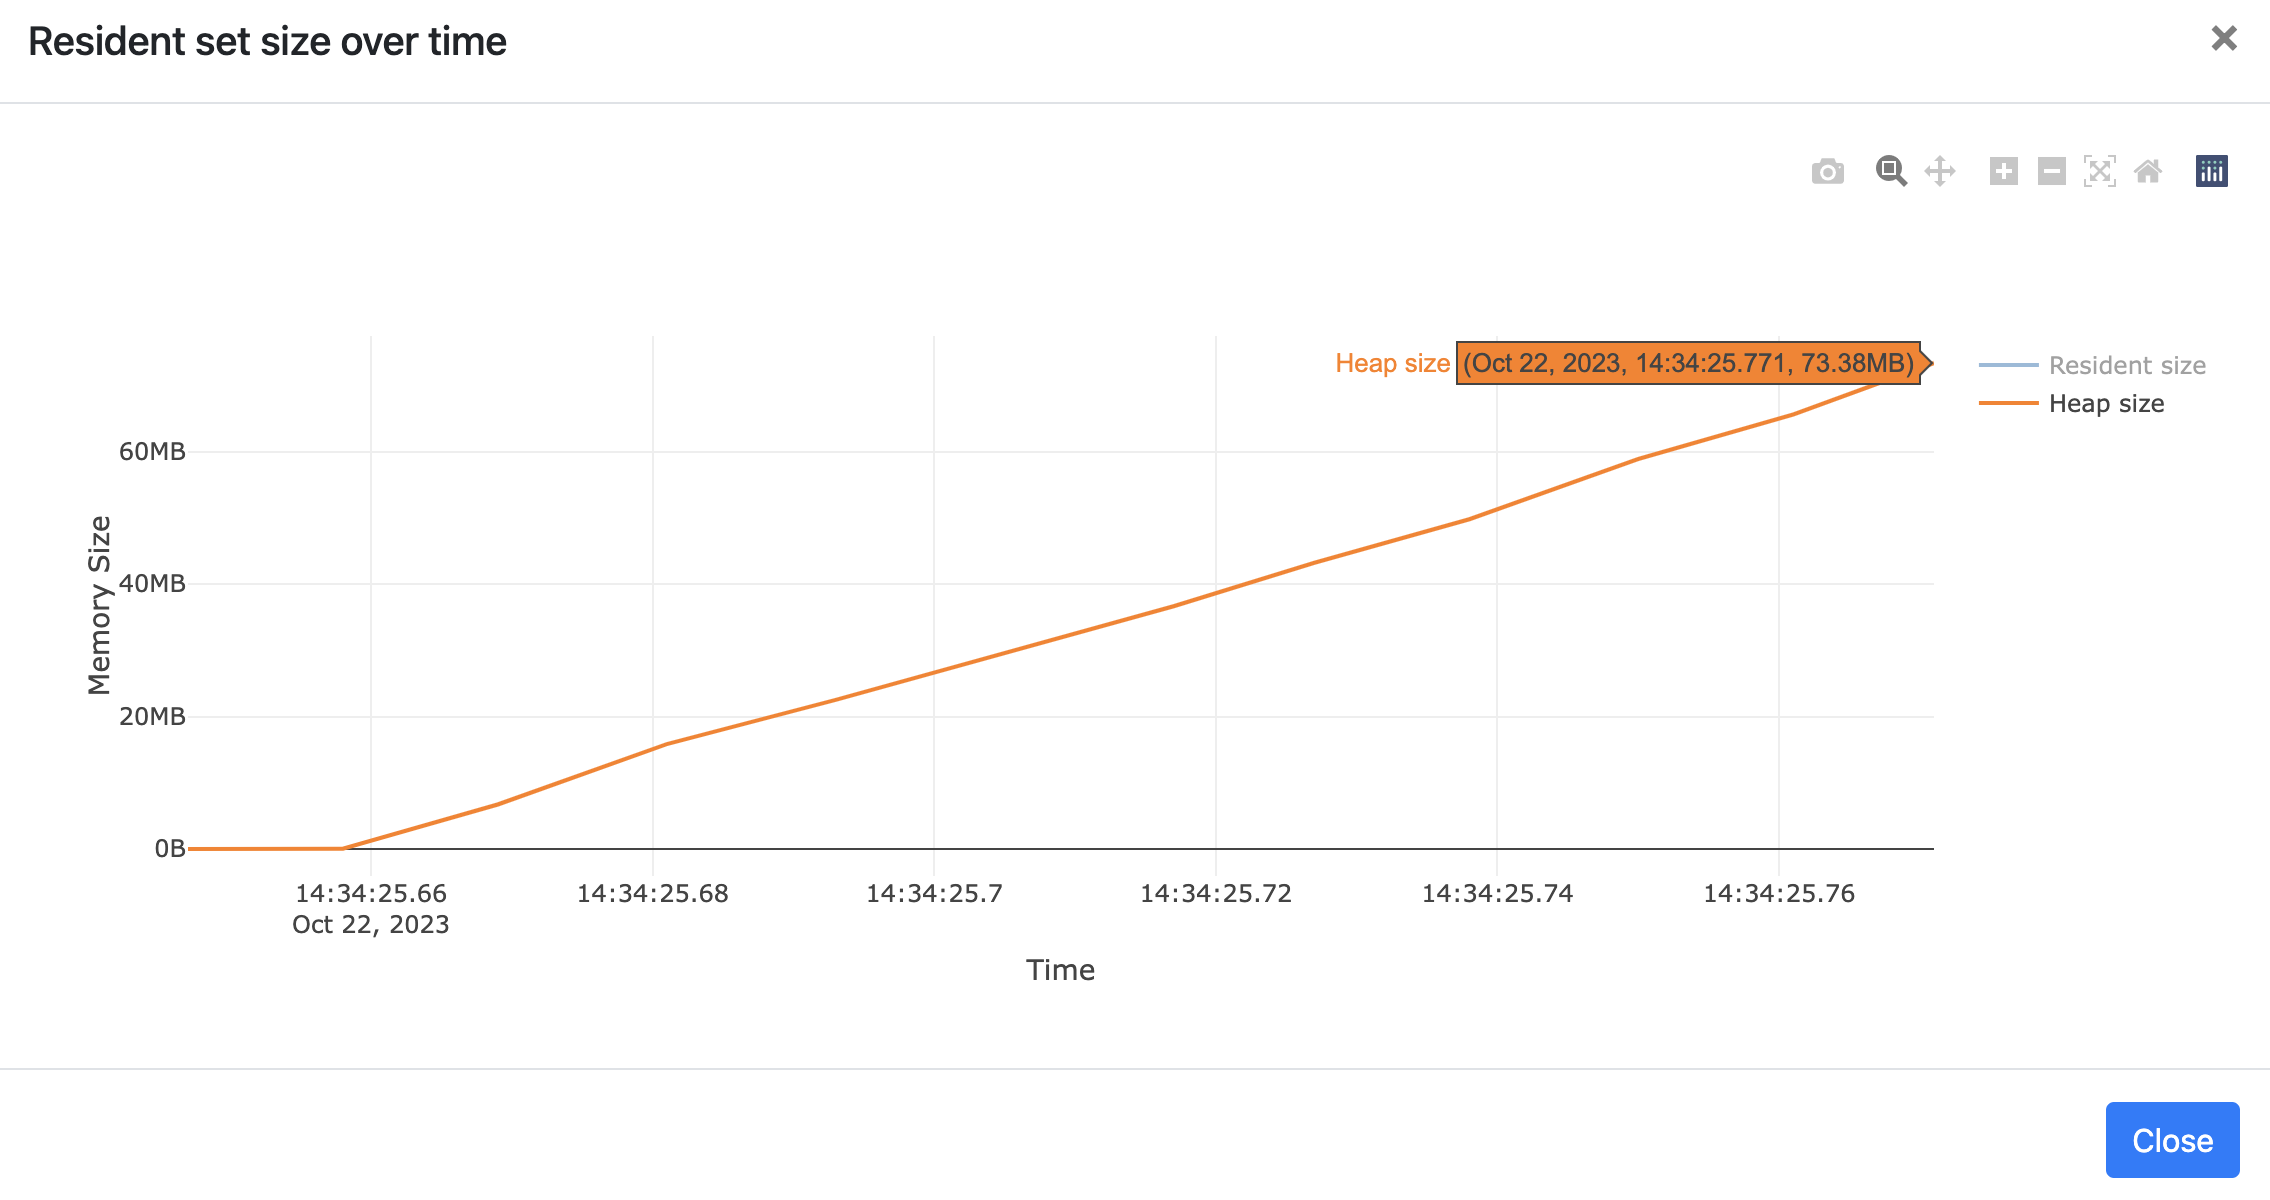
You can observe that the peak memory usage is approximately 77.3 MiB for 10 iterations. As the number of executions increases, the peak memory usage of our process also rises.
Storing values in class attributes
Here’s an exmple to illustrate the potential danger of storing values in class attributes:
class Foo:
    data: list = []  # Shared attribute

    def add_val(self, val):
        self.data.append(val)

# Keep storing values in the class attribute
for i in range(1000000):
    foo = Foo()
    foo.add_val(i)
    del foo
In this example, the Foo class has a mutable class attribute data, which is shared among all instances.
This attribute grows as add_val is called.
Even if we delete the instances, Foo.data remains in memory since it is bound to the Foo class itself, potentially leading to memory leak over time.
Therefore, you should be cautious about using class attributes unless you know what you’re doing.
You can try and see how the heap size of the example above grows over time by generating the flame graph with memray.
Pytest plugin
pytest-memray allows you to activate memray when using pytest.
Installation
You can install pytest-memray with:
pip install pytest-memray
In this post, I am using pytest-memray 1.5.0.
Basic usage
Here’s a test case that executes code from the previous example:
# test.py
def test_create_array():
    array = [i for i in range(9999999)]
You can run the test with --memray option:
$ pytest --memray test.py
The output shows allocations at the highwater mark - a point that represents the maximum memory usage:
============================= test session starts =============================
platform darwin -- Python 3.11.4, pytest-7.4.2, pluggy-1.3.0
rootdir: /
plugins: memray-1.5.0, anyio-3.7.1
collected 1 item

test.py .                                                                [100%]


================================ MEMRAY REPORT ================================
Allocation results for test.py::test_create_array at the high watermark

         📦 Total memory allocated: 391.0MiB
         📏 Total allocations: 815
         📊 Histogram of allocation sizes: |█|
         🥇 Biggest allocating functions:
                - <listcomp>:/test.py:2 -> 391.0MiB


============================== 1 passed in 0.74s ============E==================
What’s more powerful of this plugin is that it can enforce a memory limit of our code.
Here’s an example that uses a pytest marker to limit the memory usage to 10 MB:
# test.py
@pytest.mark.limit_memory("10 MB")
def test_create_array():
    array = [i for i in range(9999999)]
The output:
============================= test session starts =============================
platform darwin -- Python 3.11.4, pytest-7.4.2, pluggy-1.3.0
rootdir: /
plugins: memray-1.5.0, anyio-3.7.1
collected 1 item

test.py M                                                                [100%]

================================== FAILURES ===================================
______________________________ test_create_array ______________________________
Test was limited to 10.0MiB but allocated 396.0MiB
------------------------------ memray-max-memory ------------------------------
List of allocations:
    - 396.0MiB allocated here:
        <listcomp>:/test.py:6
        ...

================================ MEMRAY REPORT ================================
Allocation results for test.py::test_create_array at the high watermark

         📦 Total memory allocated: 396.0MiB
         📏 Total allocations: 825
         📊 Histogram of allocation sizes: |█|
         🥇 Biggest allocating functions:
                - <listcomp>:/test.py:6 -> 396.0MiB


=========================== short test summary info ===========================
MEMORY PROBLEMS test.py::test_create_array
============================== 1 failed in 0.77s ==============================
As you can see, the test failed as the execution of the code allocated more memory (396.0MiB) than it is allowed to use (10.0MiB).
Conclusion
Memory profiling is an important process for identifying memory leaks, inefficient memory usage, and other issues that can degrade the performance of our code.
And we, as software engineers, have access to tools like memray to help us solve when facing these memory-related problems.
Furthermore, by using pytest-memray plugin, we can proactively manage memory usage when developing memory-intensive applications.